import datetime
import pytz
import pandas as pd
import matplotlib.pyplot as pltChange timezone of Python datetime objects
Data engineering
How to change the timezones of Python timezone objects
TL;DR.
Use this function to change the timezone of a date/datetime column in a Pandas dataframe
def convert_timezone(column, to_timezone='US/Central', from_timezone='UTC'):
    "Convert a Pandas datetime column to a different timezone"
    column = column.tz_localize(from_timezone)\
                   .astimezone(pytz.timezone(to_timezone))\
                   .tz_localize(None)

    return column
By default, datetime objects are not tz-aware
# Default datetime object
my_datetime = datetime.datetime(2022, 2, 8, 17, 10, 27)
print (my_datetime.tzname())

# Make a tz-aware datetime
my_datetime = datetime.datetime(2022, 2, 8, 17, 10, 27, tzinfo = pytz.utc)
print (my_datetime.tzname())
None
UTCConvert the datetime from UTC to Central time zone
my_datetime_cst = my_datetime.astimezone(pytz.timezone('US/Central'))
print(my_datetime_cst.strftime('%Y-%m-%d %H:%M:%S %Z%z'))
2022-02-08 11:10:27 CST-0600Change timezone in Pandas dataframes
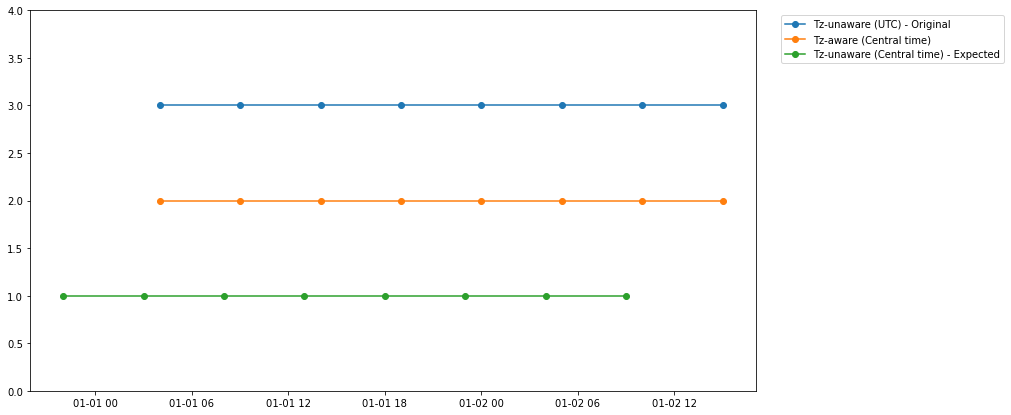
There’s a common pitfall to be aware of when changing timezones in Pandas dataframes. Simply setting the desired timezone does not seem to work as expected when plotting the data. The solution is to convert tz-aware datetime series to tz-unaware series.
my_df = pd.DataFrame()

# Generate a series of timestamps
my_df['Tz-unaware (UTC)'] = pd.date_range(start='2022-01-01 10:00:00', end='2022-01-03', freq='5H')

# Make the series tz-aware by assinging a timezone
my_df['Tz-aware (UTC)'] = my_df['Tz-unaware (UTC)'].apply(lambda x: x.tz_localize('UTC'))

# Convert series to Central time to UTC
my_df['Tz-aware (Central time)'] = my_df['Tz-aware (UTC)'].apply(lambda x: x.astimezone(pytz.timezone('US/Central')))

# Make the series tz-unaware
my_df['Tz-unaware (Central time)'] = my_df['Tz-aware (Central time)'].apply(lambda x: x.tz_localize(None))

my_df| Tz-unaware (UTC) | Tz-aware (UTC) | Tz-aware (Central time) | Tz-unaware (Central time) | |
|---|---|---|---|---|
| 0 | 2022-01-01 10:00:00 | 2022-01-01 10:00:00+00:00 | 2022-01-01 04:00:00-06:00 | 2022-01-01 04:00:00 |
| 1 | 2022-01-01 15:00:00 | 2022-01-01 15:00:00+00:00 | 2022-01-01 09:00:00-06:00 | 2022-01-01 09:00:00 |
| 2 | 2022-01-01 20:00:00 | 2022-01-01 20:00:00+00:00 | 2022-01-01 14:00:00-06:00 | 2022-01-01 14:00:00 |
| 3 | 2022-01-02 01:00:00 | 2022-01-02 01:00:00+00:00 | 2022-01-01 19:00:00-06:00 | 2022-01-01 19:00:00 |
| 4 | 2022-01-02 06:00:00 | 2022-01-02 06:00:00+00:00 | 2022-01-02 00:00:00-06:00 | 2022-01-02 00:00:00 |
| 5 | 2022-01-02 11:00:00 | 2022-01-02 11:00:00+00:00 | 2022-01-02 05:00:00-06:00 | 2022-01-02 05:00:00 |
| 6 | 2022-01-02 16:00:00 | 2022-01-02 16:00:00+00:00 | 2022-01-02 10:00:00-06:00 | 2022-01-02 10:00:00 |
| 7 | 2022-01-02 21:00:00 | 2022-01-02 21:00:00+00:00 | 2022-01-02 15:00:00-06:00 | 2022-01-02 15:00:00 |
fig, ax = plt.subplots(1, 1, figsize=(13,7))

ax.plot(my_df['Tz-unaware (UTC)'], [3 for i in range(len(my_df))], '-o', label='Tz-unaware (UTC) - Original')
ax.plot(my_df['Tz-aware (Central time)'],  [2 for i in range(len(my_df))], '-o', label='Tz-aware (Central time)')
ax.plot(my_df['Tz-unaware (Central time)'],  [1 for i in range(len(my_df))], '-o', label='Tz-unaware (Central time) - Expected')

ax.set_ylim(0, 4)

plt.legend(bbox_to_anchor=(1.35, 1))
plt.show()